Ohio State navigation bar
John Glenn College of Public Affairs
Ohio Education Research Center
Dropouts in Ohio
Teenagers who drop out of school are a problem both nationally and in Ohio. Dropouts earn less, are more likely to be jailed, and more likely to experience teen pregnancy. States that can reduce the number of dropouts typically receive more tax revenue since workers have higher wages and have fewer people being supported by government assistance.
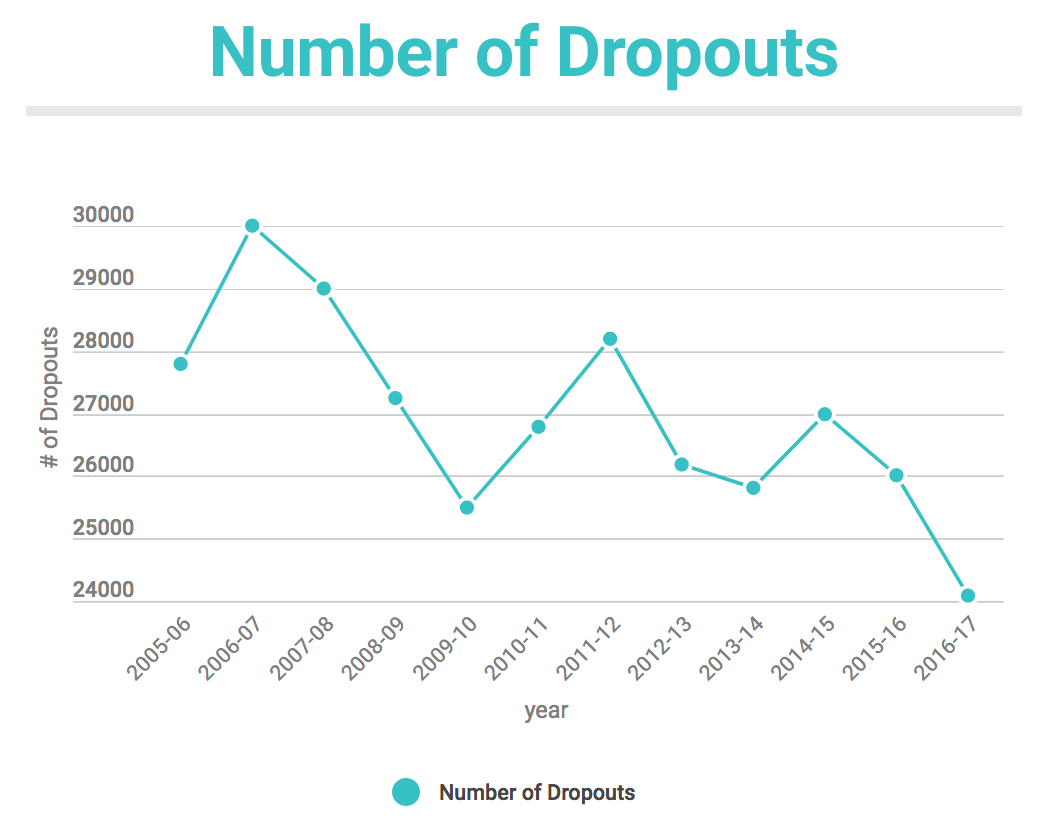
What has happened to the number of dropouts in Ohio? The below graph shows the number of students who dropped out of Ohio’s schools. The numbers are from the state’s records of all public school students. This record keeping system is called the Education Management Information System, or EMIS for short.
EMIS tracks all students who are enrolled in the public-school system. Individuals who stop attending a public school for any of the following five reasons are counted as a dropout in EMIS.
- Withdrew due to truancy or nonattendance
- Left school to pursue employment
- Left school when they were over 18 years old
- Moved to another area and are not known to be continuing their schooling
- Completed course requirements, but did not pass all portions of Ohio’s Graduation Test
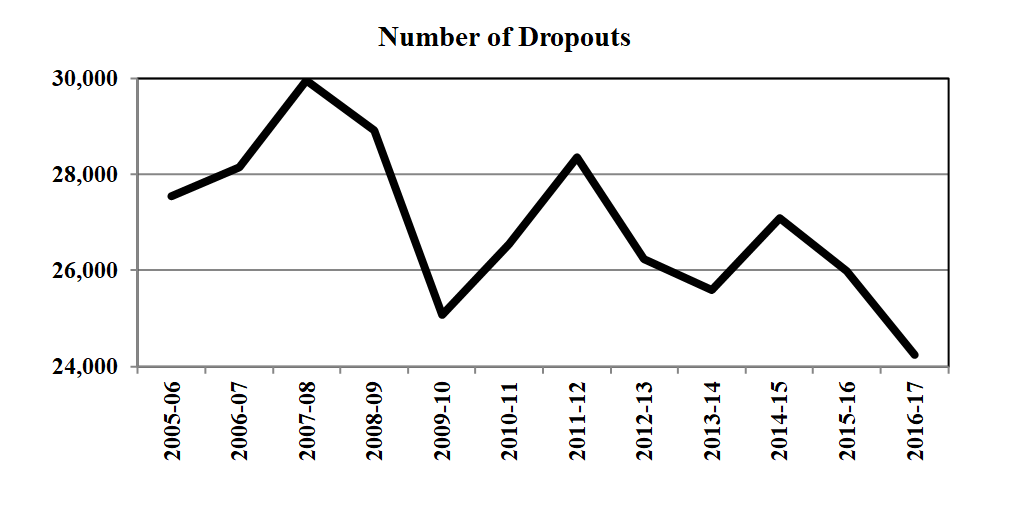
While the graph is certainly not a straight line, the trend in the number of dropouts is downward. Dropouts peaked in the 2007-08 school year with 30,000 students quitting school. In the most recent year of data, which is the school year 2016-17, only 24,000 students dropped out. Having 6,000 fewer dropouts per year is good news for Ohio!
However, looking at the number of dropouts potentially is misleading for understanding the problem of students not completing school. It is misleading because over the last decade the number of students attending public-school in Ohio has been shrinking. The number of students has fallen by over 100,000 people is just over ten years.
To adjust for a changing number of students the second graph shows the percentage of students who drop out. The percentage is calculated by dividing the number of dropouts by the total number of students. This new graph shows a more comparable picture since data on both dropouts and the number of students is included.
This second figure suggests Ohio is not seeing the same downward trend that is found in the first graph. Instead, Ohio’s dropout rate is roughly constant and fluctuates around 1.7 percent. This means slightly less than two out of every hundred students drop out of Ohio’s public-schools each year. The steady pattern seen in the dropout percent is neither good nor bad news for Ohio.
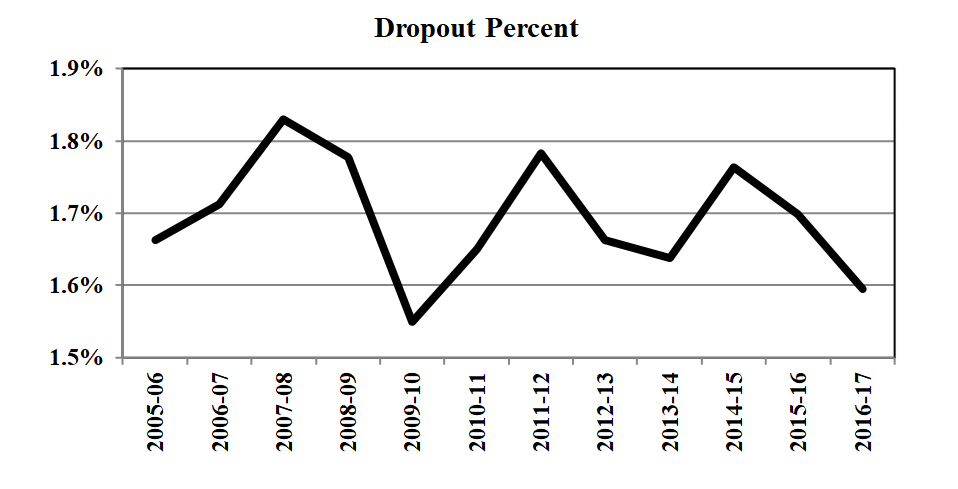
Is the dropout problem getting better, worse or staying the same in Ohio? The second graph suggests the problem is staying the same.
Is there anything that can be done to improve this situation? The Ohio Education Research Center, also called the OERC, has created an online “Student Success Dashboard.” This Dashboard uses EMIS data and provides public-school teachers and principals with three tools for reducing the dropout problem in their schools.
The Dashboard has three parts. The first part shows teachers their students’ history. At a glance teachers can see if in past years the student had issues with problems like absenteeism. Second, the Dashboard calculates the chance each student will drop out of school, repeat a grade or not finish high school in a timely manner. By looking at each student’s chances, teachers can quickly assess which students need help and which ones do not. Finally, the Dashboard contains information and suggestions for teachers and principals on what works and what doesn’t work when dealing with a student who has a high chance of dropping out.