Cross-Cluster Analysis
This section draws patterns across all 14 Career Clusters, examining gap severity, credential level composition, wage returns, and institution type reliance. Single-cluster rankings are useful but incomplete; clusters that appear moderate on gap size alone may rank near the top on wage returns or projected growth, shifting their relative priority. The exhibits here support that broader assessment.
Comparative Cluster Performance
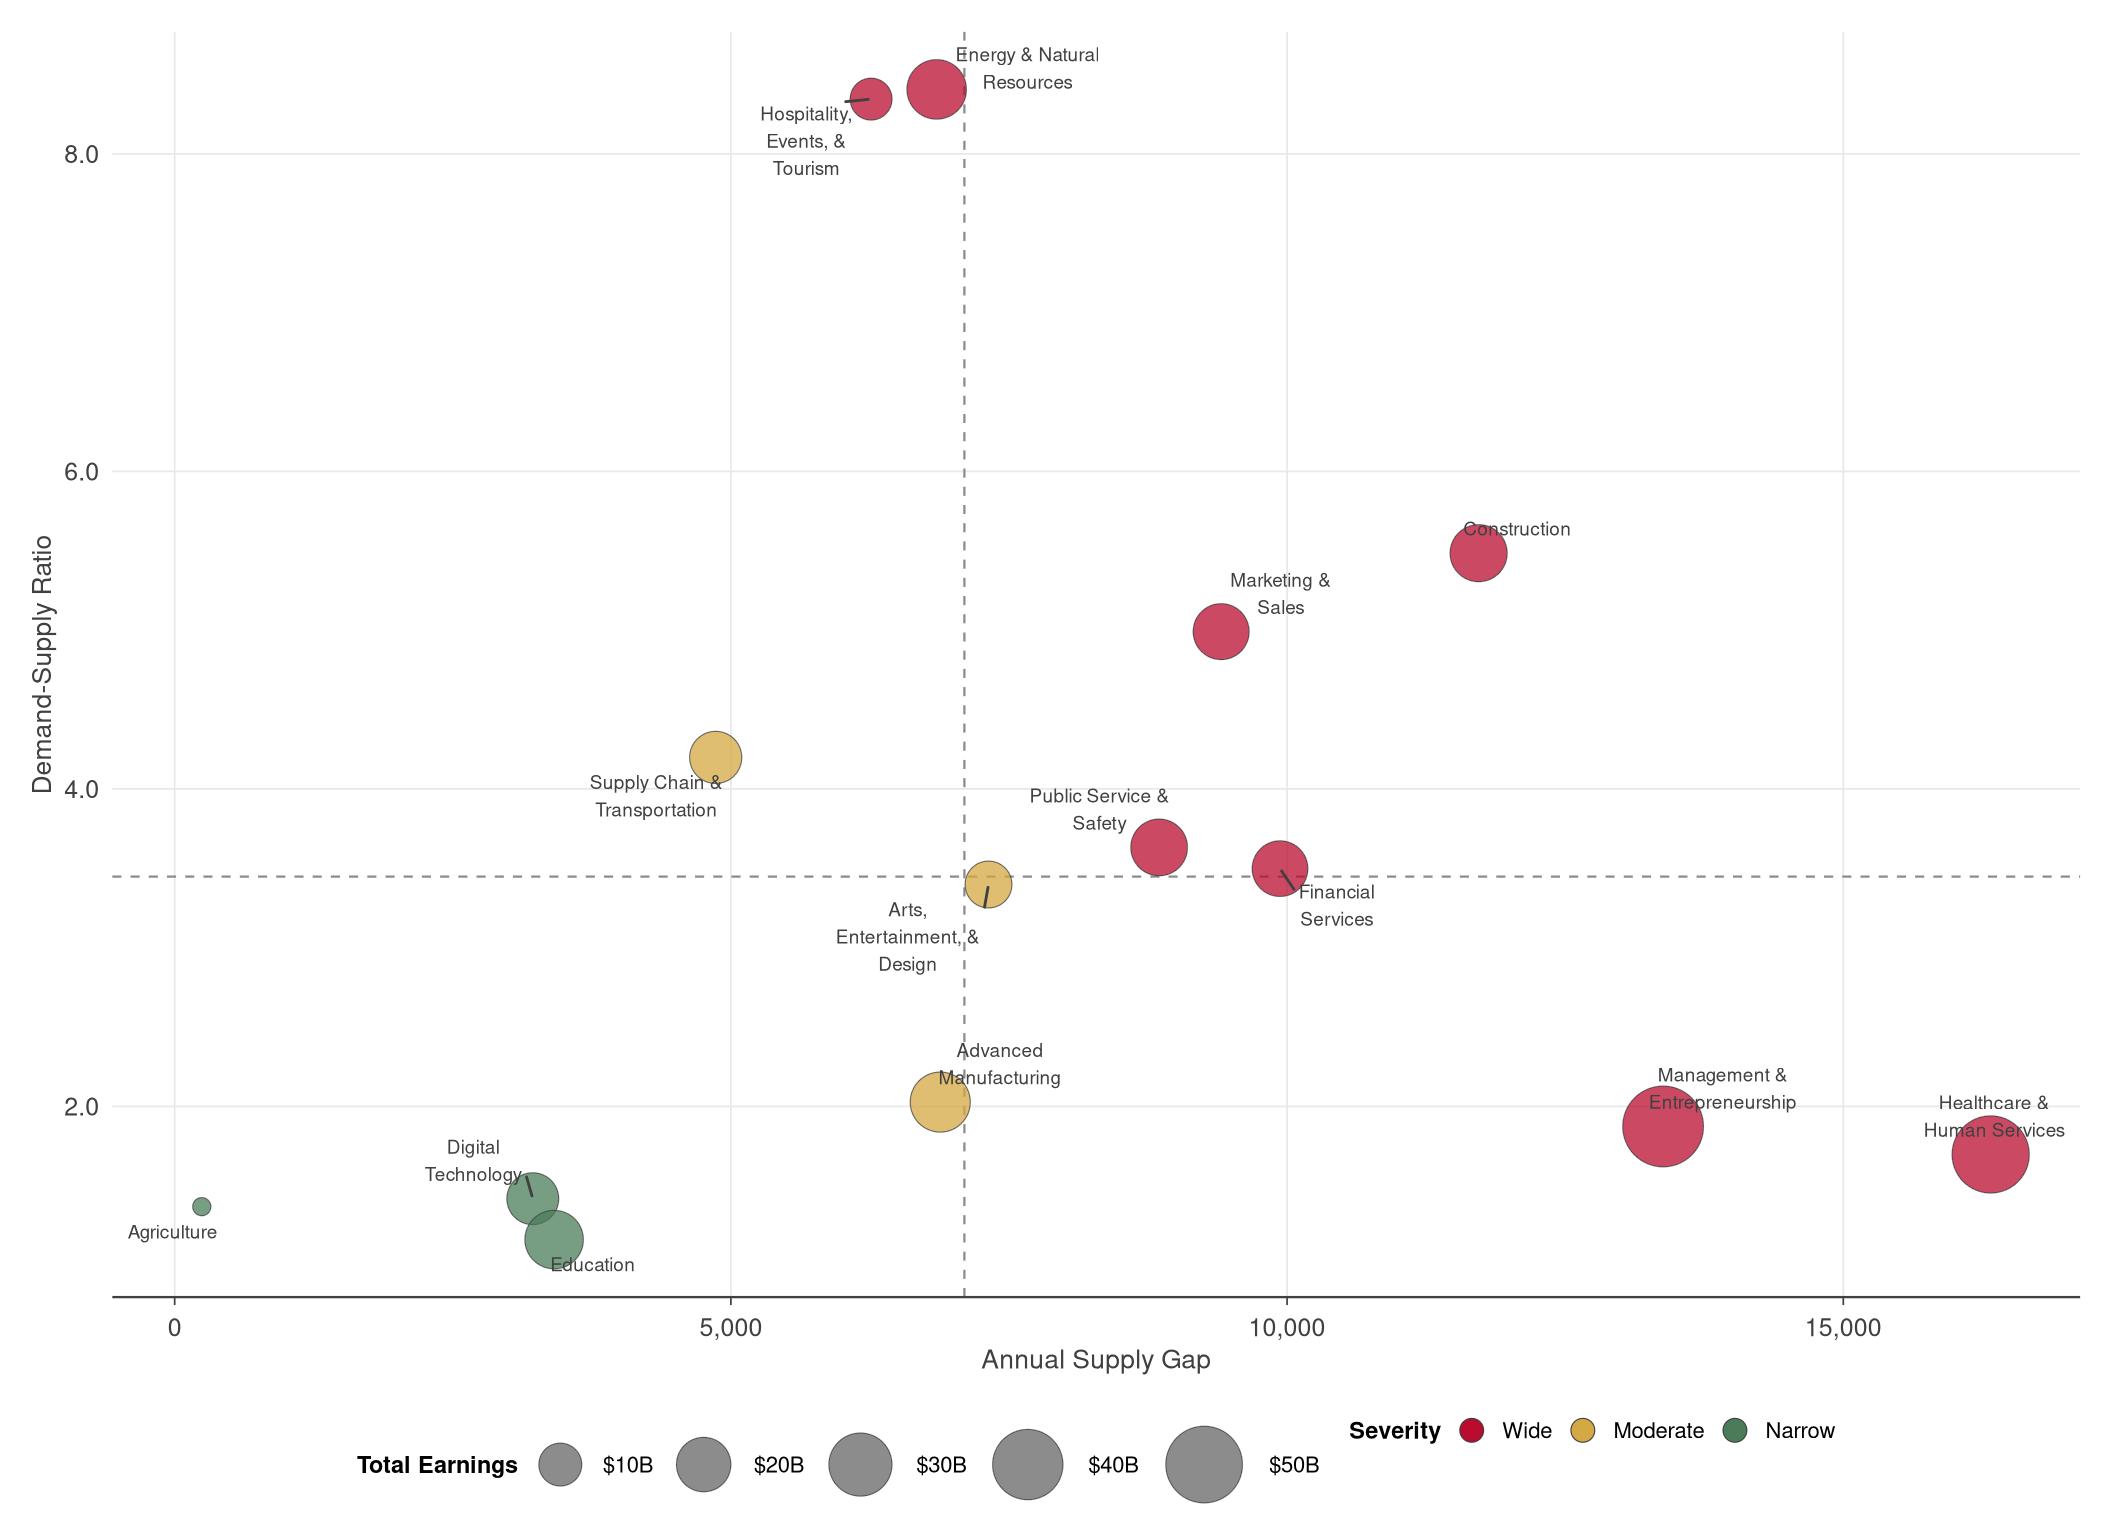
The following chart positions all 14 clusters simultaneously on supply gap size and demand-supply ratio, with bubble size reflecting total annual cluster earnings. Clusters in the upper-right area of the chart (high gap, high ratio) present the strongest case for investment. Because occupations can appear in multiple clusters, earnings figures overlap and are not additive to a statewide total. Cluster positions should be read relative to one another rather than as independent absolute values.
A companion ranking table follows this quadrant view, which presents each cluster’s standing across four dimensions: gap size, D-S ratio, average wage, and projected growth. Clusters that rank consistently near the top in all four dimensions represent the most compelling targets for sustained investment. Clusters that rank high on only one or two dimensions may call for more targeted or condition-specific responses.
| Career Cluster | Conv. Rate | Gap Rank | Ratio Rank1 | Wage Rank | Growth Rank | Priority | Severity |
|---|---|---|---|---|---|---|---|
| Healthcare & Human Services | 21.8% | 1 | 11 | 6 | 1 | High | Wide |
| Management & Entrepreneurship | 9.1% | 2 | 10 ‡ | 4 | 5 | High | Wide |
| Construction | 9.0% | 3 | 3 ‡ | 9 | 9 | High | Wide |
| Financial Services | 7.7% | 4 | 7 ‡ | 7 | 6 | High | Wide |
| Marketing & Sales | 9.7% | 5 | 4 ‡ | 11 | 10 | High | Wide |
| Public Service & Safety | 8.3% | 6 | 6 ‡ | 5 | 7 | High | Wide |
| Arts, Entertainment, & Design | 13.6% | 7 | 8 | 3 | 3 | Medium | Moderate |
| Advanced Manufacturing | 14.8% | 8 | 9 | 10 | 8 | Medium | Moderate |
| Energy & Natural Resources | 7.5% | 9 | 1 ‡ | 2 | 11 | High | Wide |
| Hospitality, Events, & Tourism | 5.0% | 10 | 2 ‡ | 14 | 13 | High | Wide |
| Supply Chain & Transportation | 15.9% | 11 | 5 | 12 | 12 | Medium | Moderate |
| Education | 16.3% | 12 | 14 | 8 | 4 | Low | Narrow |
| Digital Technology | 9.0% | 13 | 12 ‡ | 1 | 2 | Low | Narrow |
| Agriculture | 4.9% | 14 | 13 ‡ | 13 | 14 | Low | Narrow |
| 1 D-S ratio = annual demand ÷ adjusted graduate supply. Ranks marked ‡ are clusters with conversion rate < 10% (very limited higher-education pathways relative to total openings); supply gap rank is the more reliable comparator for these clusters. Gap severity based on combined z-score of gap size and D-S ratio. | |||||||
Supply Gap Composition by Education Level
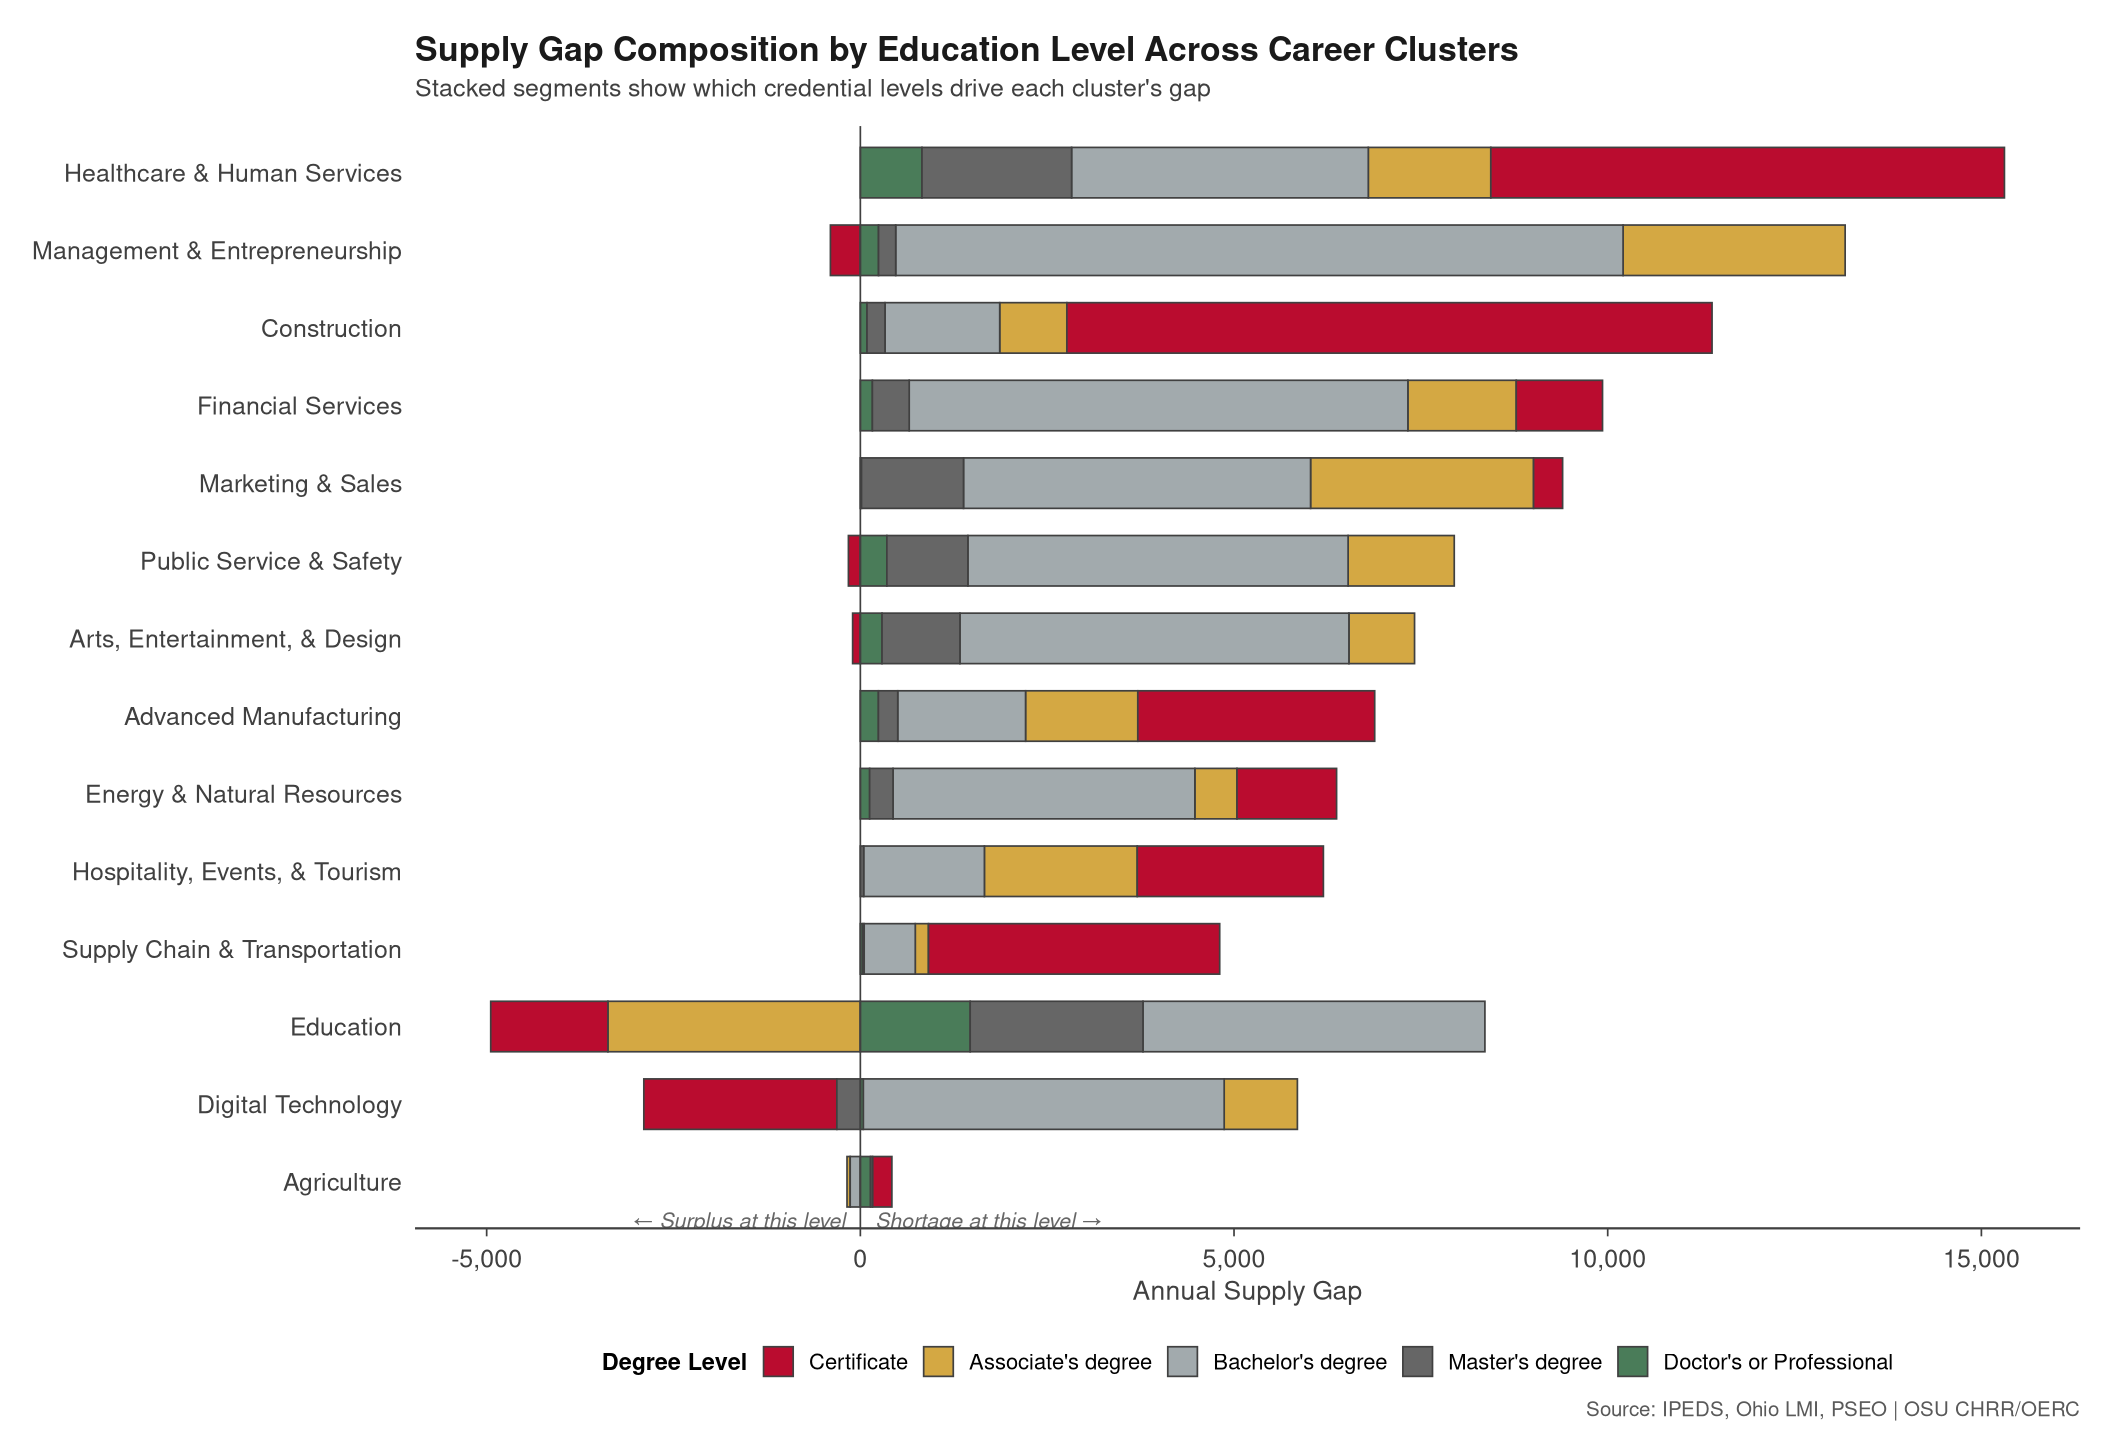
The visual below decomposes each cluster’s total supply gap by credential level, showing whether shortfalls are concentrated in sub-baccalaureate pathways or driven by bachelor’s and graduate-level imbalances. This distinction matters for directing investment: Clusters where sub-baccalaureate segments dominate, including Healthcare & Human Services and Advanced Manufacturing, signal a particular opportunity for two-year institutions and short-term credential programs. Clusters where gaps concentrate at the bachelor’s level, such as Digital Technology and Management & Entrepreneurship, point to four-year program capacity as more relevant.
Some credential levels within a cluster show negative gap values, meaning graduate production exceeds openings at that specific level even while the cluster-level total remains positive. These credential-level surpluses partially offset shortfalls at other levels and appear as leftward-extending segments in the chart. They do not indicate an overall surplus for the cluster; they reflect imbalances in how graduate production is distributed across degree types relative to the credential distribution of employer demand. These imbalances may also reflect a shift in demand needs for higher or lower credential levels as the occupation evolves its requirement for either a greater or less educated workforce.
Institution Type Specialization
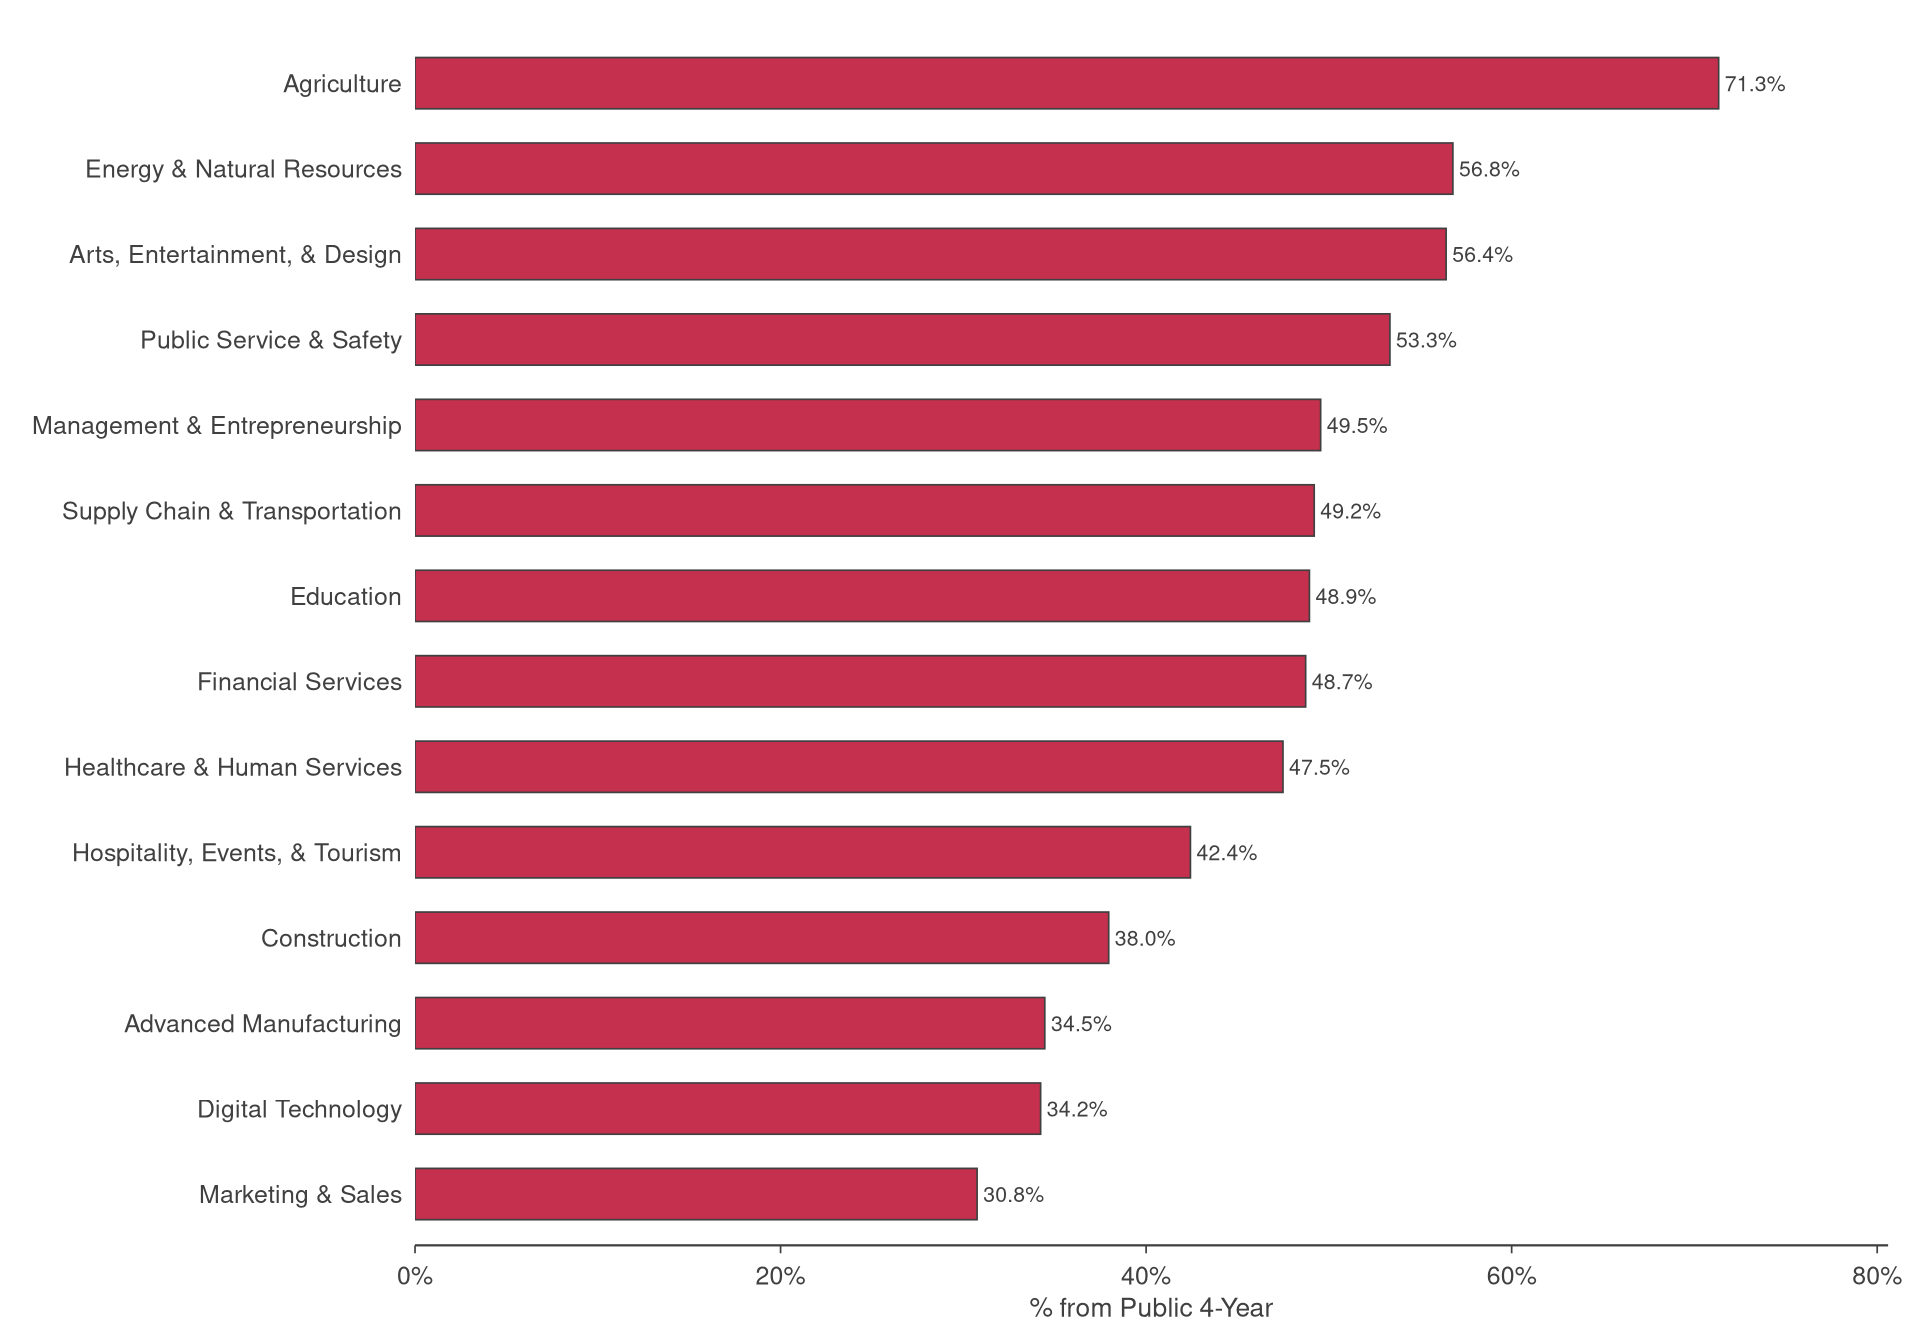
Next for each cluster, we show the graduate-weighted share of adjusted supply coming from public four-year institutions. Clusters with the highest public four-year concentration, including Agriculture, Energy & Natural Resources, Arts, Entertainment, & Design, and Public Service & Safety, face a more concentrated supply risk: Shifts in public four-year enrollment, retention, or program capacity have an outsized effect on total graduate output for these clusters. Expanding pathways through two-year and private institutions would reduce that dependence and broaden the pipeline.